What’s Next After $20 Oil and the RMB Devaluation?

Yesterday (January 26, 2016) marked the first significant break from US equities trading in lock step with Chinese indices, even in the face of an overnight drop of over 6% on the Chinese Hang Seng index (Describe how equity correlations and correlation volatilities behave throughout various economic states[MR-8]. What most talking heads on CNBC miss about the cratering oil prices is the economic benefit to lower energy prices only if there is someone left standing to actually sell a product to – which is very unlikely in 2016. The new canary in the coal mine is the onshore/offshore RMB market. But first, a little background.
Today’s US/China equity divergence should at least mark the “local low”, where focus has returned to what will always be one of many extraordinary economic benefits the United States rightfully enjoys: a stable currency, safe harbor status for capital outflows (which now stands at over 1 trillion from China alone), and a global destination for innovation. The jump in US future prices is a clear break in correlation (Calculate and interpret the covariance and correlation between two random variables [QA-2] from the worldwide “hit the exits” mentality. However, the carnage is not over for the emerging markets (Summarize trends over the past 10 years in and emerging market financial products [CI-4].
The one albatross facing the United States is the extraordinary use of securitized asset vehicles to bundle oil assets, which lead to increasingly precarious, astronomical valuations (Explain the various performance analysis tools for securitized structures and identify the asset classes to which they are most applicable [CR-17]. The United States bank’s exposure is significant but limited. Even if the US bank losses on oil loans are realized, in the worst case scenario loan loss reserves won’t exceed $25 billion dollars – a manageable capital hit that wouldn’t lead to contagion (Describe policy measures that can alleviate firm-specific and systemic risks related to large dealer banks [OR-14].
What is less clear is the degree to which Venezuela and Saudi Arabia have used securitized assets to secure FX swaps with central banks in the west (Explain how to create a synthetic commodity position, and use it to explain the relationship between the forward price and the expected future spot price [FMP-12]. I suspect this is quite high, higher than what the market expects. When Bahrain shut down Al-Jazeera America earlier this month because of increasing budget deficits, it signaled just a hint of panic. Shuttering Al-Jazeera is like discontinuing lawn service in the hopes of using the savings to prevent foreclosure. When Bahrain goes that low on the cost savings food chain, you know stresses have entered new territory (Evaluate implied volatility as a predictor of future volatility and its shortcomings [VRM-1].
Even in the worst case scenario of a Brazil or Venezuela default, and the potential ripple effect to other central banks, those central bank balance sheets are so disconnected from reality the likely impact is just another footnote that adds the loss to already bloated levels of borrowing and credit (Compare instances of sovereign default in both foreign currency debt and local currency debt, and explain common causes of sovereign defaults [VRM-12]. So, where does real market contagion lie, if not with sovereign defaults, and what is the forward-looking indicator? Enter the actively traded onshore vs offshore Chinese RMB currency rates.
The immense control the Central Bank of China exercises over foreign investment and the opacity of its capital account have led to a dual market in local currency, resulting in the onshore/offshore price divergence. Over the last decade, China has liberalized some of its investment policy and, as a result, the outstanding offshore holdings of RMB in the form of CDs, Trade Credit, and bonds have exploded to over 1 trillion RMB ( ~$170 Billion). Of far greater importance than the size of the market is the relative convergence and divergence among the markets and the signals these shifts send. The official market (USD:CNY) can be tracked via Bloomberg online data here, and the offshore market (USD:CNY) here.
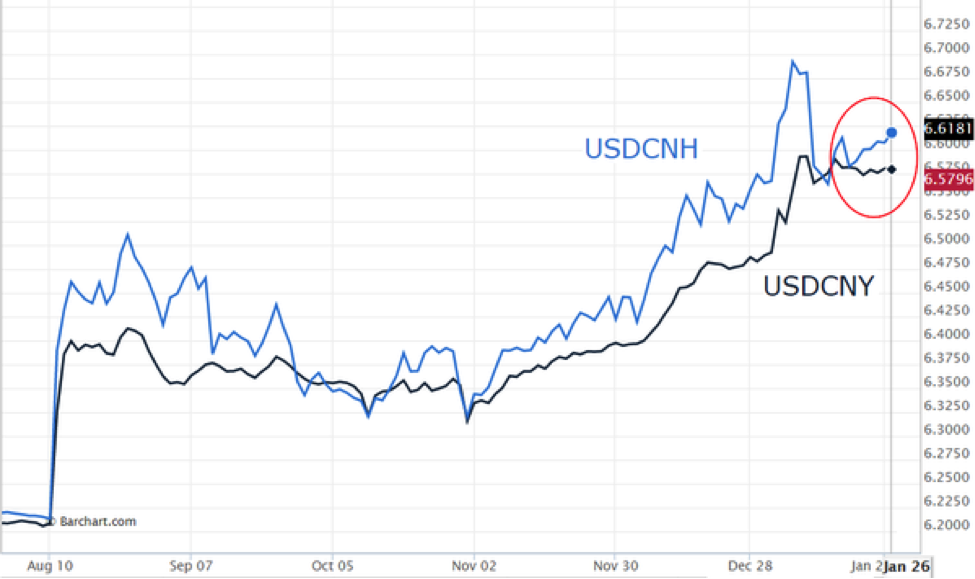
The divergence and shift in the correlation between the two markets will likely foreshadow any move by the Central Bank of China to even further devalue its currency, and is a “must watch” leading indicator for 2016. Over the last few days, we can already see a divergence of the value between capital held in Beijing (USDCNH) and the value of the RMB freely available to trade offshore (USDCNY) (Describe characteristics of foreign exchange rate distributions and their implications on option prices and implied volatility [MR-17]. Here, a higher value in the USDCNH means it takes more of the currency held in China to buy one US dollar – this higher numerical value implies a lower relative intrinsic value.
Since the central bank controls the official “fixing” of its currency, China can proceed along a path of “unofficial” devaluation as it moves the fixing weaker to the USD without adopting an official policy of devaluation – a very significant nuance and one that will come at the expense of immense Chinese political capital.
I believe the next shoe to drop will be an official Chinese devaluation at some point this year, which will signal a extraordinary acknowledgment: the structural cost of shifting millions of its citizens from rural producers to urban consumers will come at a financial cost that will rival the human cost of the Great Leap Forward of the 1960s. This structural shift hasn’t even begun to be properly priced in by the Chinese government and rest of the world. The oil market, however, has begun to price this reality in. The traditional mindset of, “lower oil prices equals cheaper growth” only applies if there is growth to be had or if a decade of growth hasn’t already been borrowed from the future by zero cost fiat cash and inflated asset prices via the corporate cannibalization of stock buybacks.
The shock of an RMB devaluation will not be contained by footnotes on the central bank balance sheets of the west, but rather will push other countries within the newly created Trans-Pacific Partnership (TPP) to devalue in a race to the bottom of the currency barrel. The first crack will appear in the chart above. The only safe places right now are, ironically, the United States or the newly opened Iran. It is only a matter of time before the world scrambling for yield realizes there is a brand new, modern financial system that is stable, trading at a P/E ratio of 5 and a dividend yield of 15.
The pursuit of the FRM designation isn’t just for “risk managers”, just like the CFA designation is no longer for “analysts”. As we enter a period of lower for longer growth, the inevitable banking layoffs, and an employer demand for increased sophistication, the FRM designation is the perfect complement to those already possessing the CFA or those who want to understand how the world’s front page headlines fit with the back page. The exam is tough by design but, with the right guide, the pieces can come together.