CFA Economics
As a central theme at each CFA exam level, Economics is one of the most important topics in the CFA program. It’s important for CFA candidates to build a firm foundation as they work through the Level I material which will serve them well as they continue to Level II and Level III.

CFA Economics Quick Facts
- Economics represents 8-12% topic weight in Level I, 5-10% in Level II, and 5-10% in Level III.
- The Economics Curriculum consists of two Study Sessions which contain seven readings.
- The Economics subject matter is grouped into three categories: Microeconomics, Macroeconomics, and International Economics.
- Wiley’s variety of study guides and materials give you everything you need to master Economics before each CFA exam.
CFA Level I Economics At A Glance
The difference between Microeconomics and Macroeconomics is that Microeconomics is the study of individuals and businesses, while Macroeconomics studies countries and governments. The two complement one another and have many overlapping issues.
CFA Economics Level I Study Tips
Even though the exam formats vary on each Level, these foundational study methods will serve you well as you prepare for the Level II and Level III exams as well.
Understand The Core CFA Economics Concepts Don’t Just Memorize Them
While memorization can serve you well on some sections of the CFA exam, it won’t help when it comes to CFA Economics. Instead, you’ll need to focus on understanding the concepts and being able to apply them to real-life situations. You’ll also need to understand the logic between economics concepts and how they relate to each other in order to master this part of the exam.
Speed Up Your Understanding Of CFA Economics
The best way to study for CFA Economics is by taking advantage of the materials offered by Wiley. One way to speed up your understanding of CFA Economics is with prerequisite readings. Wiley offers three key readings containing over 80 pages of study text with examples, figures, and coverage of Learning Outcome Statements from the CFA Institute.
Engage In Dialogue About Economics In Real Life
Another important aspect of your preparation for CFA Economics is engaging in dialogue about Economics in real life. A great way to do this is to plug into Wiley’s online forums and group study pages. You should also consider joining a study group and have some of these discussions with other CFA candidates.
Keep Practicing Economics-specific Questions
And don’t forget to keep practicing Economics-specific questions over and over. Take extra time to drill yourself to get familiar with the topic and make practice questions and mock exams a core part of your study sessions. This will not only help you as you approach the Level I CFA exam, but will also build a foundation for Level II and Level III.
CFA Level I Economics: Summarizing The Chapter Readings
Reading |
Sub-topic |
Description |
|---|---|---|
| 8 | Topics in Demand and Supply Analysis | Reading 8 deals with several concepts that take the basic market model of demand and supply in assessing a firm’s shutdown points and breakeven of production. |
| 9 | The Firm and Market Structures | Reading 9 shows how companies interact and compete in various market conditions including oligopoly, monopolistic competition, perfect competition, and pure monopoly. |
| 10 | Aggregate Output, Prices, and Economic Growth | Reading 10 introduces gross domestic product (GDP), aggregate demand, aggregate supply, and sources of economic growth. |
| 11 | Understanding Business Cycles | Reading 11 includes the theory of business cycles and takes on the differences between deflation, inflation, hyperinflation, and disinflation. |
| 12 | Monetary and Fiscal Policy | Reading 12 talks about the tools used by central banks and governments that guide and optimize their country’s economy through fiscal policy. |
| 13 | International Trade and Capital Flows | Reading 13 introduces international trade and capital flows while explaining international trade and balance of payments. |
| 14 | Currency Exchange Rates | Reading 14 discusses how exchange rates are quoted and calculated and shows the effect of exchange rates on international trade and capital flows. |
Reading 8 Explained: Topics In Demand And Supply Analysis
There are plenty of supply concepts covered as well, including total, average, and marginal product of labor; total, variable, and marginal cost of labor; and total and marginal revenue.
Own-price Elasticity Of Demand
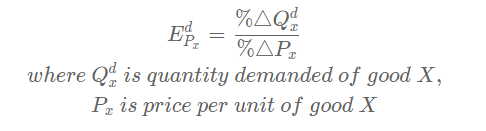
Note: own price elasticity of demand (PED) is typically negative:
- If PED<1, demand is inelastic;
- If PED=1, demand is unit elastic;
- If PED>1, demand is elastic.
- If PED=0, demand is perfectly inelastic, i.e. vertical demand curve.
- If PED=∞, demand is perfectly elastic, i.e. horizontal demand curve.
Income Elasticity Of Demand
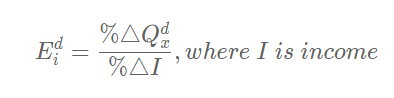
Note: income elasticity of demand is positive for normal good and negative for inferior good.
Cross-price Elasticity Of Demand
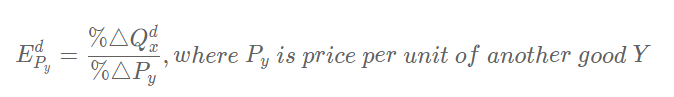
Note: cross-price elasticity of demand is positive for substitutes and negative for complements.
Income And Substitution Effects
Substitution and Income Effects for a Normal Good
The law of demand states that when the price of a good falls (rises), quantity demanded
increases (decreases). There are two main reasons for this:
- The substitution effect: The good becomes relatively cheaper compared to other goods, so more of the good gets substituted for other goods in the consumer’s consumption basket.
- The income effect: The consumer’s real income increases (in terms of the quantity of goods and services that can be purchased with the same dollar income). If the good is a normal good (which most goods are), the increase in real income (due to the decrease in its price) leads to an increase in quantity purchased.
Income and Substitution Effects for an Inferior Good
An inferior good is one that has negative income elasticity of demand. When income increases (decreases) demand for these goods falls (rises). When price falls, demand for inferior goods is also influenced by the income and substitution effects but the two effects drag quantity demanded in opposite directions.
Giffen Goods
A Giffen good is a special case of an inferior good where the negative income effect of a decrease in price of the good is so strong that it outweighs the positive substitution effect. Therefore, for a Giffen good, quantity demanded actually falls when there is a decrease in price, which makes the demand curve upward sloping.
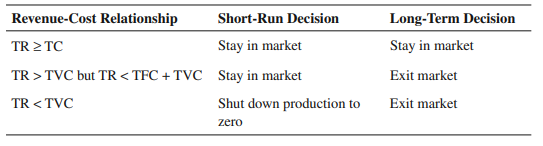
Breakeven And Shutdown Analysis In Production
Profit maximization is when the difference between Total Revenue (TR) and Total Cost (TC) is the greatest. The level of output for this to occur is when:
- Marginal Cost (MC) = Marginal Revenue (MR), and
- MC is rising
Breakeven occurs when:
- TR=TC, and
- price (average revenue) = average total cost (ATC)
At this breakeven level, economic profit is zero, although it may still earn a positive accounting profit (normal profit).
Production shutdown analysis in the short run & long run (TVC = total variable cost):
Reading 9 Explained: The Firm and Market Structures
Characteristics |
Perfect competition |
Monopolistic market |
Oligopoly |
Monopoly |
|---|---|---|---|---|
| Number of sellers | Many | Many | Few | Few |
| Entry and exit barriers | Very low | Low | High | Very High |
| Product differentiation | Identical products | Substitutes but differentiated | Close substitutes or differentiated via features, quality, and advertising. | Unique products, no close substitutes. |
| Pricing power | None | Some | Some to sizable. | Sizable |
| Other features | Firms face a perfectly elastic demand curve. All firms make normal profits in the long run. | Firms face a downward sloping demand curve. All firms make normal profits in the long run. | Firms face a downward sloping demand curve. | Firms face a downward sloping industry demand curve. They can make economic profits in the long run if unregulated. |
Reading 10 Explained: Aggregate Output, Prices, And Economic Growth
Gross Domestic Product (GDP)
Expenditure approach:
GDP = C + I + G + (X – M)
Income approach:
GDP = Net domestic income + Consumption of fixed capital + Statistical discrepancy
Expenditure Approach:
GDP = Consumer Expenditures (C) + Business Investment (I) + Government Spending (G) + Exports (X) – Imports (I)
Income Approach:
GDP = Total National Income + Sales Tax + Depreciation + Net Foreign Factor Income
Expenditure And Income Equality
(G – T) = (S – I) – (X – M)
- (G – T) = fiscal balance
- (S – I) = savings less domestic investments
- (X – M) = trade balance.
Financing a fiscal deficit: (G – T > 0)
- the private sector must save more than it invests (S > I)
- and/or imports (M) should exceed exports (X), i.e. M – X > 0
Factors Causing A Shift In Aggregate Demand (AD)
Insert the formula and any important/relevant context or background information to help people use it. A table to demonstrate how increases in specifics shifts the AD curve and the rationale would make this information easier to digest.
Factors Causing A Shift In Aggregate Supply (AS)
Insert the formula and any important/relevant context or background information to help people use it. A table to demonstrate how increases in specifics shifts short run and long run AS and the rationale would make this information easier to digest.
Impact Of (Combined) Changes In AD And AS
Insert the formula and any important/relevant context or background information to help people use it. A table to demonstrate how changes in AS and AD affect GDP and aggregate price level would make this information easier to digest.
Reading 11 Explained: Understanding Business Cycles
What Are The 4 Phases Of Business Cycles?
The 4 phases of business cycles are as follows:
- Expansion
- Peak
- Contraction
- Trough
Business Cycle Theories At A Glance
Theories |
Brief description |
Recommended Policies |
|---|---|---|
| Neo-classical | Free market. | No recommendation. |
| Austrian | A government intervention that is causing fluctuations. | No recommendation. |
| Keynesian | Advocates government intervention during a recession. | Use fiscal and monetary policy as necessary. |
| Monetarist | Monetary policy | Maintain steady money supply growth. |
| New classical | Applies microeconomic analysis to macroeconomics. | Do nothing, let it be |
What Are The Types Of Unemployment?
The three types of unemployment are as follows:
- Structural Unemployment – This type of unemployment happens when there is no demand for a specific type of worker.
- Frictional Unemployment – This type of unemployment is common when workers change jobs or are in a job transition.
- Cyclical Unemployment – This type of unemployment occurs during times of economic growth and decline.
What Are The Types Of Inflation?
The types of inflation are as follows:
- Cost-Push Inflation – This type of inflation can be summarized as an increase in production costs that lead to a rise in the prices of goods and services.
- Demand-Pull Inflation – This type of inflation occurs when there is an excess demand for goods and services and the economy sectors rush for the remaining goods or services that are available.
Reading 12 Explained: Monetary And Fiscal Policy
Reading 12 discusses the tools central banks and governments use that guide and optimize their economies. The reading identifies two types of government policy that can affect macroeconomy and financial markets.
Quantity Theory Of Money
MV = PY, where M = quantity of money, V = velocity of money circulation, P = price level, Y = real output.
Fischer Effect
Rnom = Rreal + πe
where Rnom= nominal interest rate, Rreal= real interest rate, πe= expected inflation rate.
Monetary Policy
Monetary policy covers central bank activities that are directed toward influencing the amount of money and credit in the economy. Here are the tools to implement monetary policy:
- Open Market Operations (OMO) – A central bank’s buying or selling of short-term Treasuries and other securities in the open market to increase or decrease money supply.
- Central Bank Policy Rate – The rate used by the central bank to implement or signal its monetary policy position.
- Reserve Requirements – The amount of funds held by a bank to ensure it is able to meet liabilities and supply goes up and down.
Contractionary vs. Expansionary Monetary Policy:
- Contractionary Monetary Policy – Forces spending lower and helps cool off overheated economies with high inflation.
- Expansionary Monetary Policy – Aims to increase spending to boost a stagnant or slow moving economy.
Limitations of monetary policy requires that central banks can’t control how much a household saves and can’t control how much a bank is willing to lend and expand credit.
Fiscal Policy
Contractionary vs. Expansionary Fiscal Policy
- Contractionary Fiscal Policy helps control inflation in high growth economies by reducing government spending and/or increasing taxes.
- Expansionary Fiscal Policy helps to lift aggregate demand in sluggish economies by increasing government spending and/or reducing taxes.
Fiscal Policy Spending vs. Fiscal Revenue Tools
Fiscal spending tools |
Fiscal revenue tools |
|---|---|
| Transfer payments: redistribution of wealth. | Direct taxes: Taxes on income. |
| Current government spending on goods and services. | Indirect taxes: Taxes on goods and services. |
| Capital expenditure: Infrastructure spending. |
Limitations to fiscal policy include recognition lag, action lag, and impact lag.
Fiscal Multiplier
Fiscal multiplier= 1−MPC(1−t)
1
where MPC = marginal propensity to consume, t = taxes
Reading 13 Explained: International Trade And Capital Flows
Reading 13 provides an introduction to analyzing international trade and capital flows and their economic implications. After the introduction,
Section 2 defines basic terminology used in the reading along with international trade and capital flow trends, while Section 3 describes trade restrictions and their implications.
Section 4 tackles balance of payments and Section 5 talks about the function and objectives of international organizations that facilitate trade.
Understanding Comparative Advantage And Absolute Advantage
This section will also discuss the difference between comparative advantage and absolute advantage.
- Absolute advantage describes the ability of a country to produce more of a good or service than a competitor at a lower cost.
- Comparative advantage describes the ability of a country to produce a good or service with lower opportunity costs than a competitor.
Understanding The Ricardian And Heckscher-Ohlin Models Of Comparative Advantage
This table helps to explain the differences between the Ricardian and Heckscher-Ohlin models of comparative advantage.
Ricardian |
Heckscher-Ohlin |
|---|---|
| Countries without absolute advantages benefit from trade from comparative advantages. | The comparative advantages of a country are based on relative scarcity of resources. |
| Labor is the only variable factor of production. | Capital and labor are the variable factors of production. |
| Technological differences are the main source of comparative advantage. | Assumes the technology in each industry is the same. Factor endowment differences are the main source of comparative advantage. |
Regional Trading Blocs
Here are the five different types of regional trading blocs:
- Free Trade Area (FTA) – All barriers for importing and exporting goods are removed.
- Customs Union (CU) – Member countries and free-trade area countries adopt a common trade policy amongst non-members.
- Common Market (CM) – Customs Union and all barriers to the movement of labor and goods are removed among member countries.
- Economic Union (EU) – Common Market and member countries establish common institutions and member policies.
- Monetary Union (MU) – Economic Union and member countries adopt a common currency.
Balance Of Payments (Bop) Components
There are three BOP components. They are defined as follows:
- Current Account: This measures the flow of goods and services.
- Capital Account: This measures transfer of capital.
- Financial Account: This records investment flows.
Current Account (CA) = X – M = Y – (C + I + G)
Reading 14 Explained: Currency Exchange Rates
Reading 14 covers how exchange rates are quoted and calculated, how to calculate cross exchange rates and foreign exchange rates, the different exchange rate regimes worldwide, and the effect of exchange rates on international trade and capital flows.
CFA Curriculum Exchange Rate Convention: Key Tip For CFA Level 3 Economics
One critical aspect of the CFA Economics Curriculum is the point that exchange rate notation is different from the real world. This is especially important as candidates approach the CFA Level III exam due to all of the foreign exchange questions. Here is an example to note as you prepare.
In the real world, EUR/GBP of 1.15 means EUR 1 = GBP 1.15.
But in the CFA curriculum, EUR/GBP of 1.15 means EUR 1.15 per GBP 1. This is the opposite in the real world, so be ready if you see real world exchange rate example questions.
Exchange Rate Calculations
When it comes to exchange rate calculations, it’s good to know that nominal exchange rate is the quoted currency exchange rate overall, while real exchange rate adjusts the nominal exchange rate for inflation compared to a base period.
Real exchange rate d/f =Nominal exchange rate d/f × CPId CPIf
where d = domestic currency, f = foreign currency, CPI = consumer price index
- Relationship between forward rates, spot rates, and interest rates:
Forward exchange rated/f=Spot exchange rated/f×1+rd1+rf
Forward exchange rate d/f =Spot exchange rate d/f × 1+rf 1+rd
where rd = risk-free rate of domestic currency, rf = risk-free rate of foreign currency
Exchange Rate Regimes At A Glance
Exchange rate regimes |
Description |
|---|---|
| Formal dollarization | Adopts another country’s currency. |
| Monetary union | Several countries that adopt the same currency. |
| Currency board system | Commitment to exchange domestic currency for a specified foreign currency at a fixed exchange rate. |
| Fixed parity / fixed peg | A country pegs its own currency with a foreign currency within a +/- 1% margin. |
| Target zone | Similar to fixed parity, but with a wider margin. |
| Crawling peg | Exchange rate is pegged but adjusted periodically. |
| Crawling bands | Gradually increasing the margins of the fixed peg bands to transition from fixed peg to floating rate. |
| Managed float | Monetary authority intervenes to manage exchange rate without any specific target level. |
| Independently floating | Market-driven exchange rate. |
CFA Level I Economics: Test Your Understanding
CFA Economics – Frequently Asked Questions (FAQs)
Here are answers to some frequently asked questions about CFA Economics.
- Yes, Economics is a major theme throughout each level of the CFA program.
- Economics is hard in CFA Level I but can be mastered with the right study approach and trusted materials provided by Wiley. It’s also challenging since there are various theories (e.g., Keynesian, monetarist, etc.) and sometimes it’s difficult to recall the similarities/differences.
- There are many ways to study Economics for the CFA exam, including practice questions, mock exams, and group study.
- Yes, Econometrics is part of the CFA Economics curriculum.
- There are two study sessions and seven readings on CFA Level I Economics. This means you’ll need to set aside plenty of hours to study.